Bilinear surface#
A bilinear patch is the simplest tensor-product surface: four corners
define a net of shape (3, 2, 2) and degrees \((1,1)\). Its coordinate
lines are straight, although four noncoplanar corners produce a curved
surface.
Inputs and corner convention#
nurbspy.nurbs_surface_bilinear.NurbsSurfaceBilinear takes four
three-dimensional corner arrays. Its argument names follow this mapping:
Argument |
Surface parameter |
Control-net entry |
|---|---|---|
|
\((0,0)\) |
|
|
\((1,0)\) |
|
|
\((0,1)\) |
|
|
\((1,1)\) |
|
In this helper’s notation,
The helper’s .NurbsSurface attribute exposes the usual evaluation and
plotting interface.
Complete script#
Run python demos/documentation/bilinear_surface.py, or
download the script.
"""Construct a bilinear surface from four corner points."""
import numpy as np
import matplotlib.pyplot as plt
import nurbspy as nrb

nrb.set_plot_options()

# This helper names its corners P00, P01, P10, P11 in this order:
# (u,v) = (0,0), (1,0), (0,1), (1,1).
P00 = np.array([0., 0., 0.])
P01 = np.array([2., 0., 0.3])
P10 = np.array([0., 2., 0.5])
P11 = np.array([2., 2., 1.5])
surface = nrb.NurbsSurfaceBilinear(P00, P01, P10, P11).NurbsSurface

u = np.array([0., 1., 0., 1.])
v = np.array([0., 0., 1., 1.])
corners = np.column_stack([P00, P01, P10, P11])
corner_error = np.max(np.abs(surface.get_value(u, v) - corners))
print("Control net shape:", surface.P.shape)
print(f"Degrees: ({surface.p}, {surface.q})")
print("Midpoint:", surface.get_value(0.5, 0.5)[:, 0].round(6))
print(f"Maximum corner error: {corner_error:.2e}")

fig, ax = surface.plot(surface_color=nrb.COLORS_MATLAB[0],
                       control_points=True, isocurves_u=7, isocurves_v=7)
ax.set_title("Bilinear surface from four corners")
ax.view_init(elev=25, azim=-55)
# Leave room for the 3D axis labels when displaying or exporting the figure.
fig.set_size_inches(7, 6)
fig.subplots_adjust(left=0.05, right=0.85, bottom=0.15, top=0.9)
ax.set(xlabel="$x$", ylabel="$y$", zlabel="$z$")
for axis in (ax.xaxis, ax.yaxis, ax.zaxis):
    axis.labelpad = 4
plt.show()
Output#
The midpoint is [1. 1. 0.575], the average of the four corners.
The script checks that each corner is interpolated exactly to numerical
precision. The red control net and black isoparametric curves are drawn by
surface.plot(control_points=True, isocurves_u=7, isocurves_v=7).
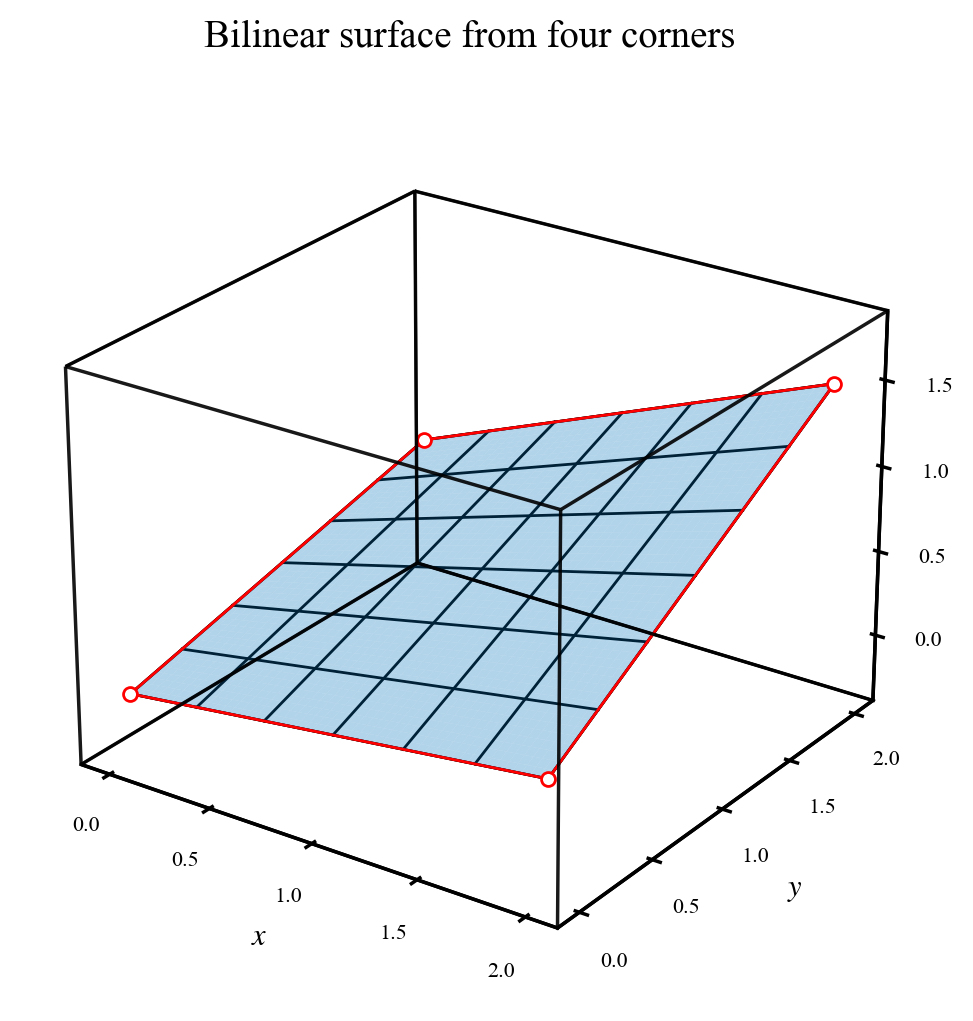
Four corners define a surface that is linear in each parameter separately.#